Organizations using the Request feature, will also get a graphical and statistical representation of various Request information such as Request Type, Request team and also with their current status.
Prerequisites of Request Report
Accessing the Request Report
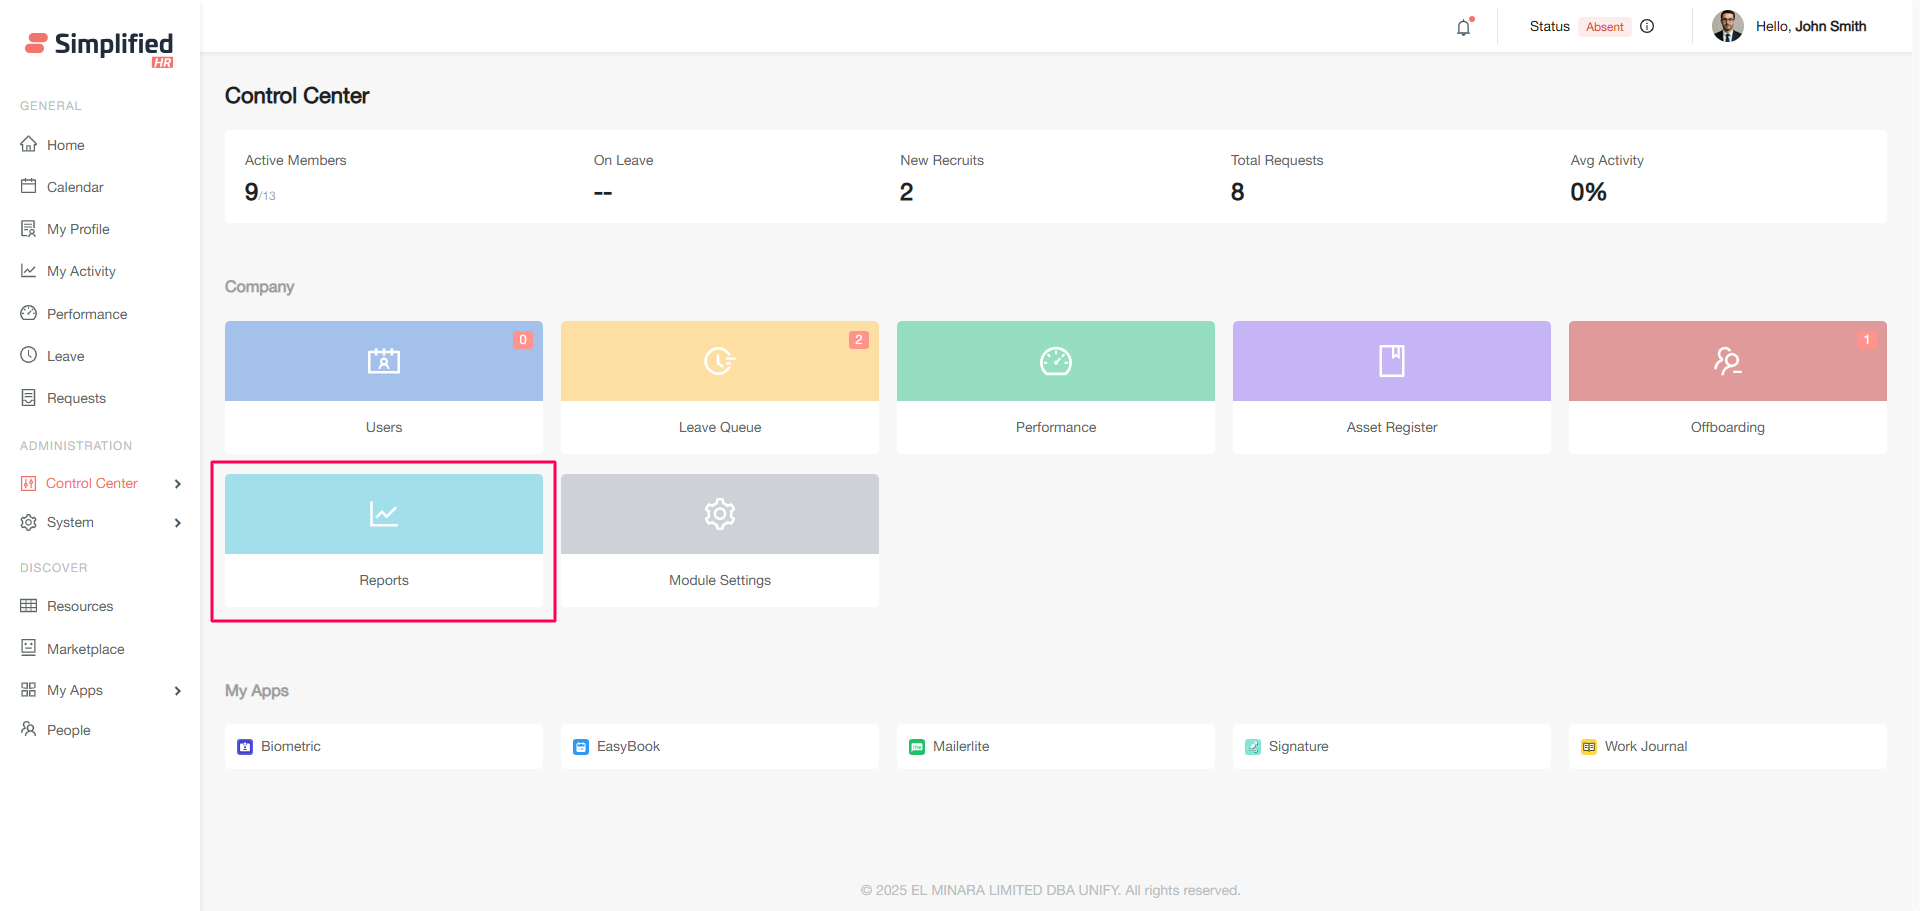
With proper permissions, one can navigate the following for accessing Request Report:
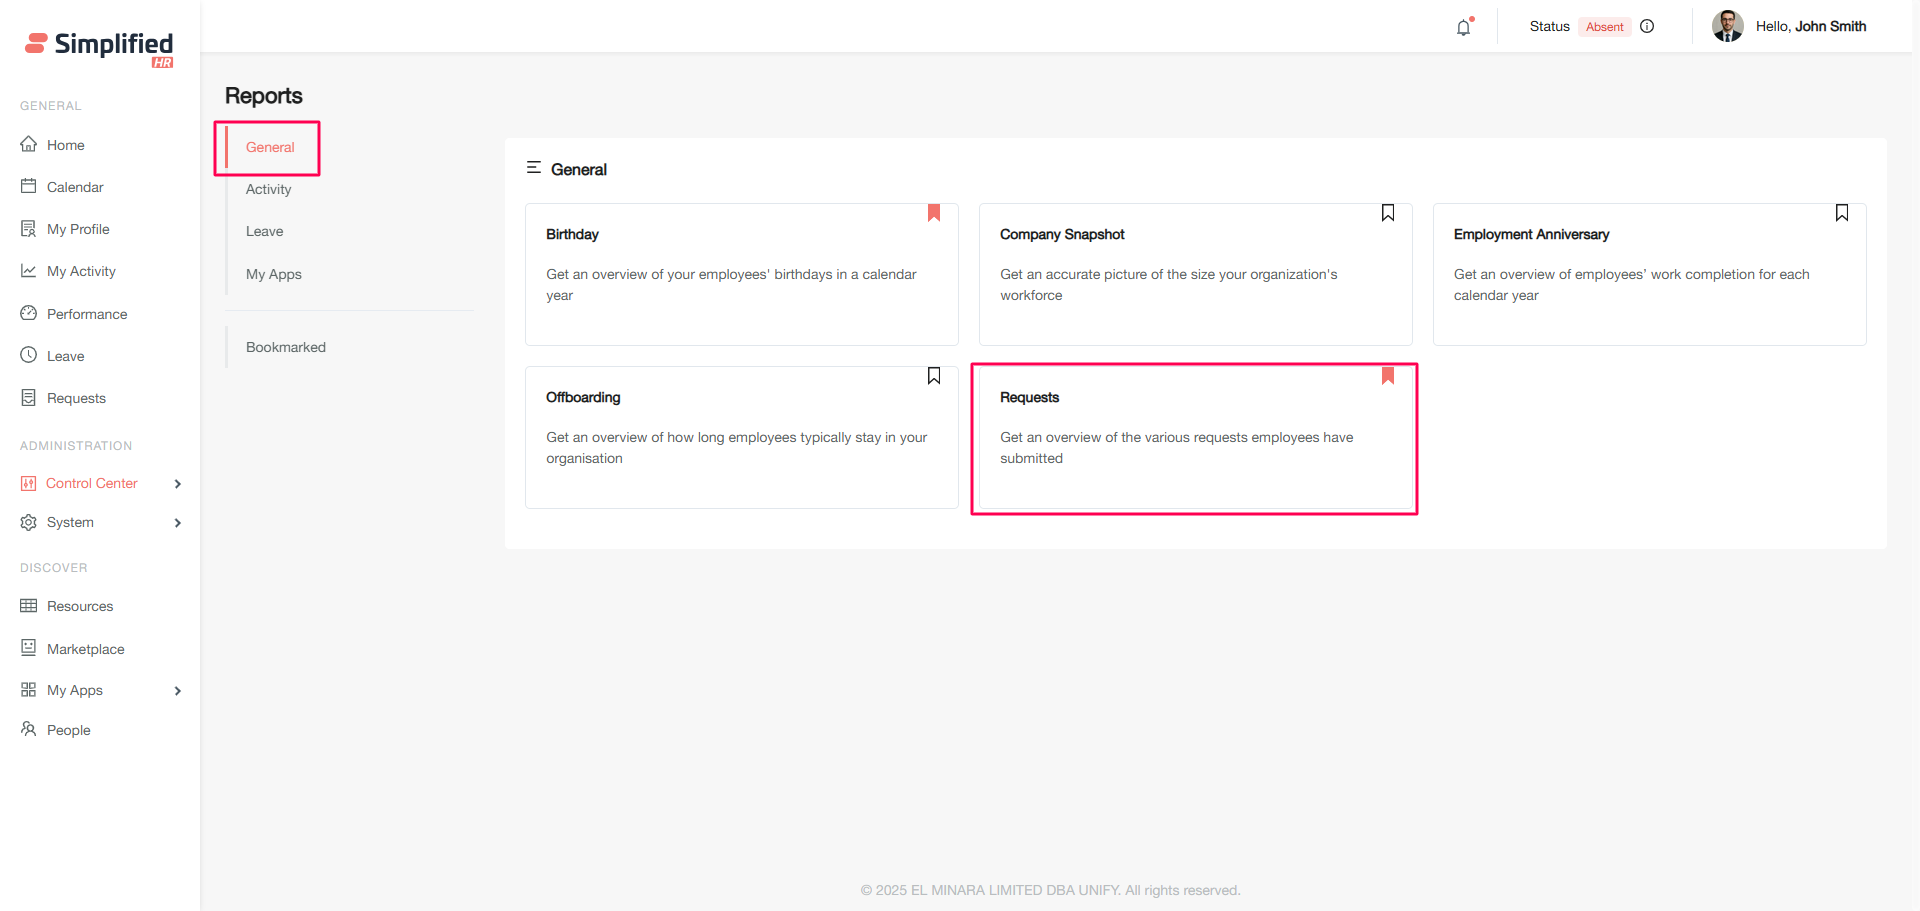
Control Center page > Report Card > General > Request
Or
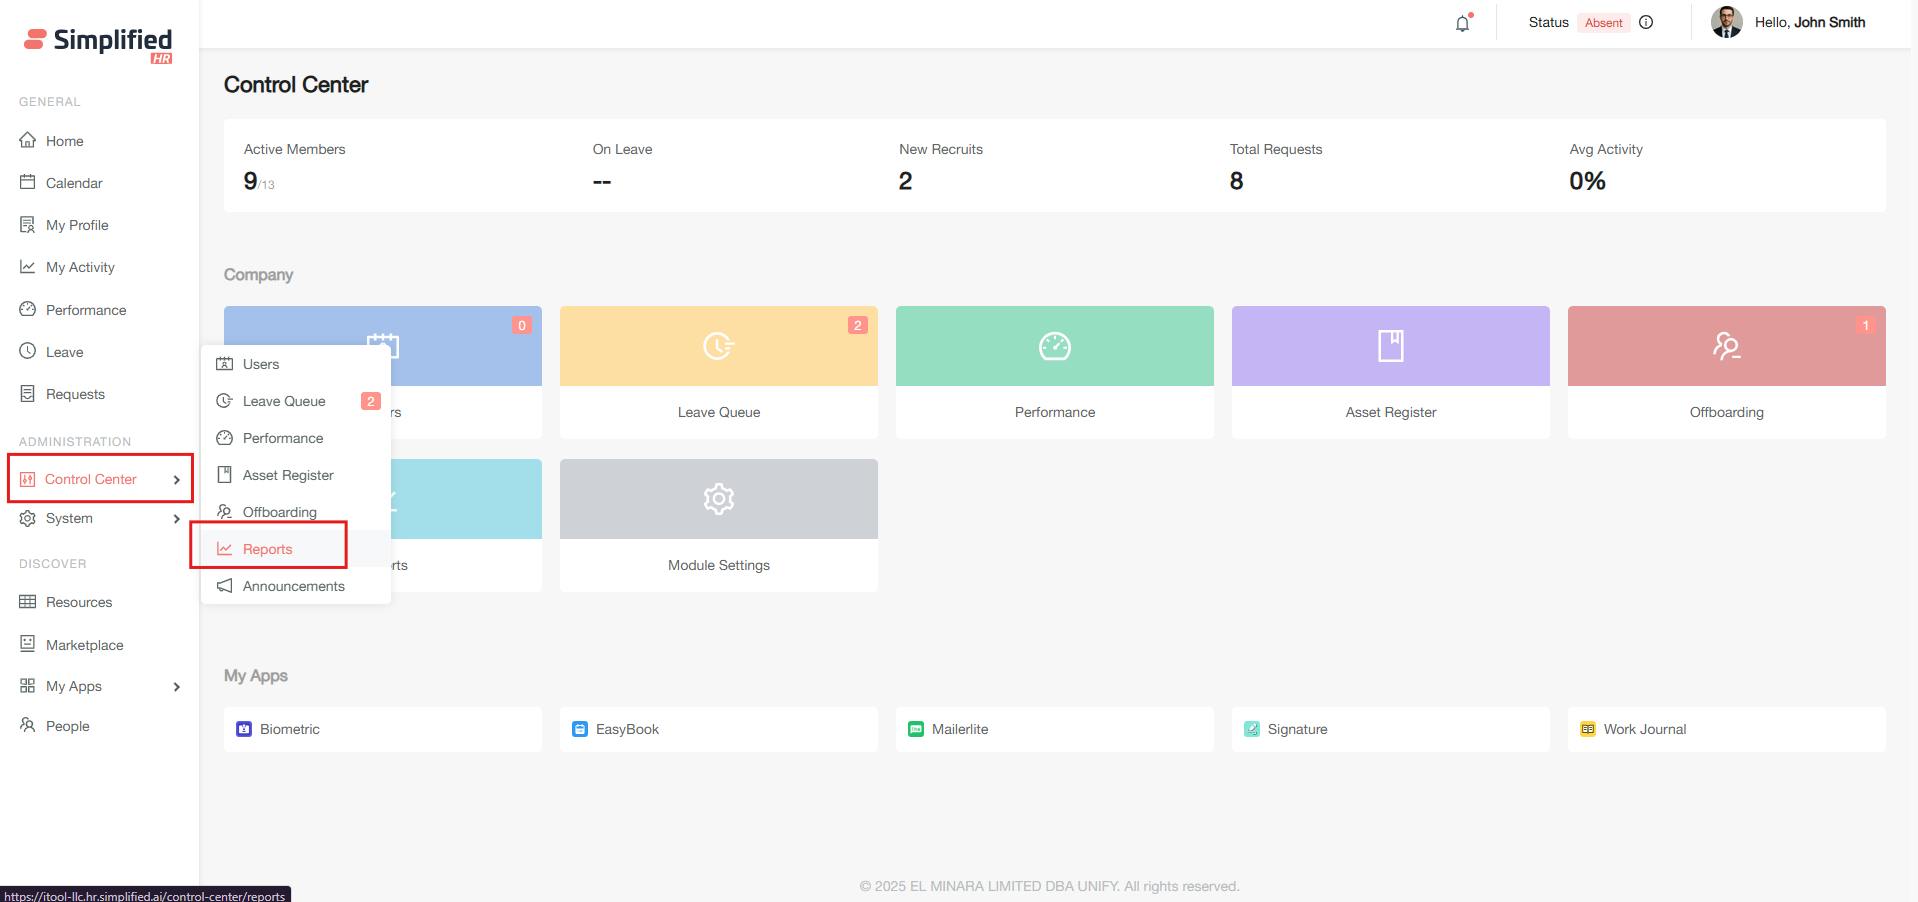
Control Center menu > Report > General > Request
Specifications
Overview
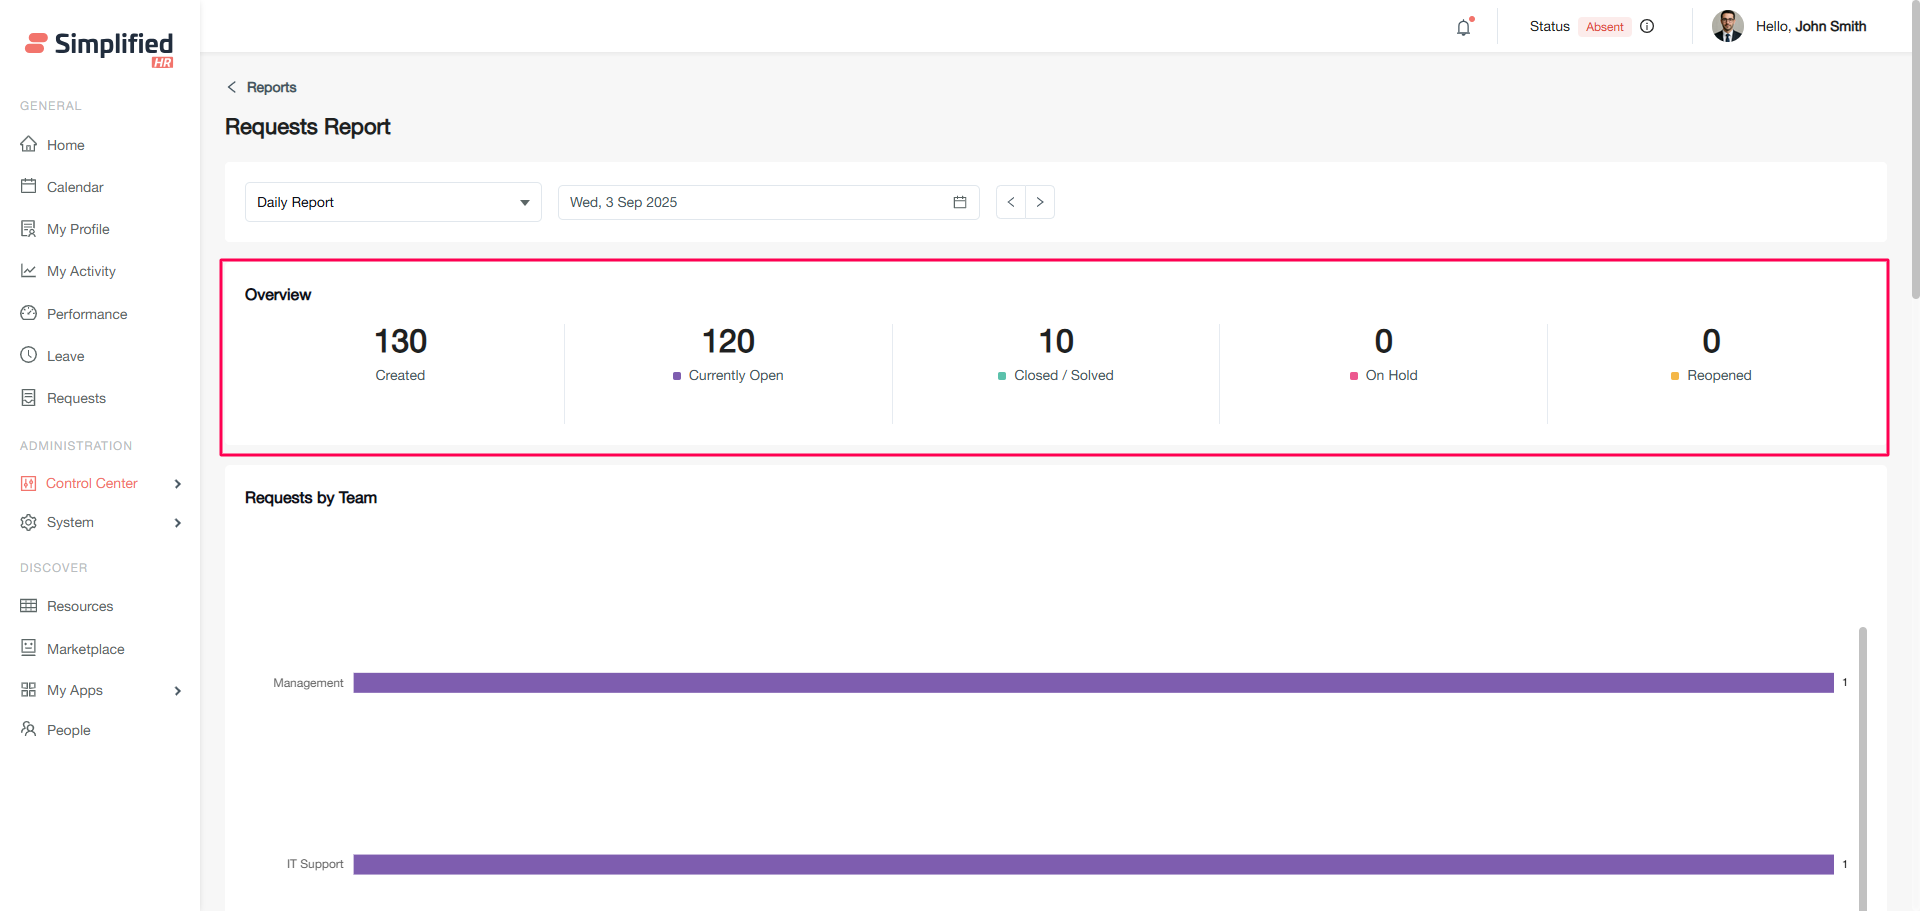
Daily
Overview will show how much request is Created, Open, On Hold and Closed on the current date if the Daily report is selected. The default date selected will be the current date, however one can navigate to the previous dates as per requirement.
Weekly
Overview will show how much request is Created, Open, On Hold and Closed on the current week or previous weeks if the Weekly report is selected. The default week selected will be the current week, however one can navigate to the previous weeks as per requirement.
Monthly
Overview will show how much request is Created, Open, On Hold and Closed on the current month or previous months if the Weekly report is selected. The default month selected will be the current month, however one can navigate to the previous months as per requirement.
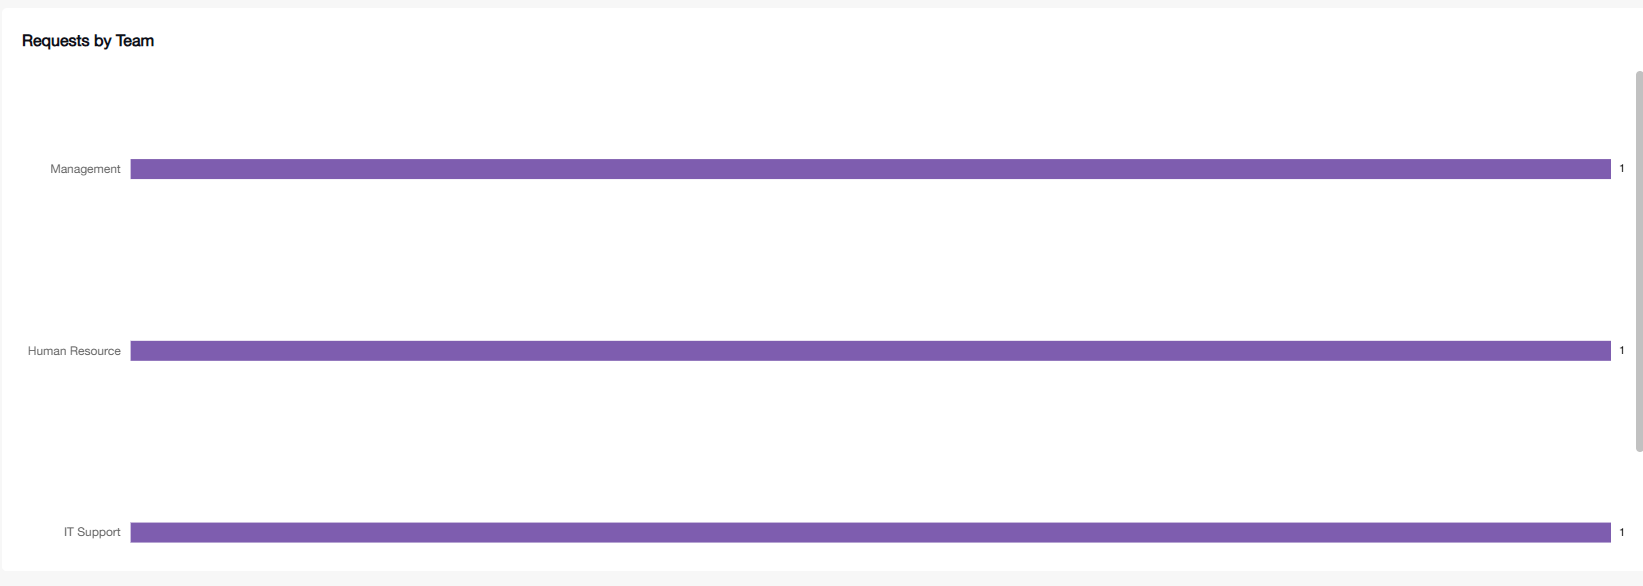
Requests by Team
This section will show what amount of request is raised to what team/department or request category based on Daily/Weekly/Monthly basis.
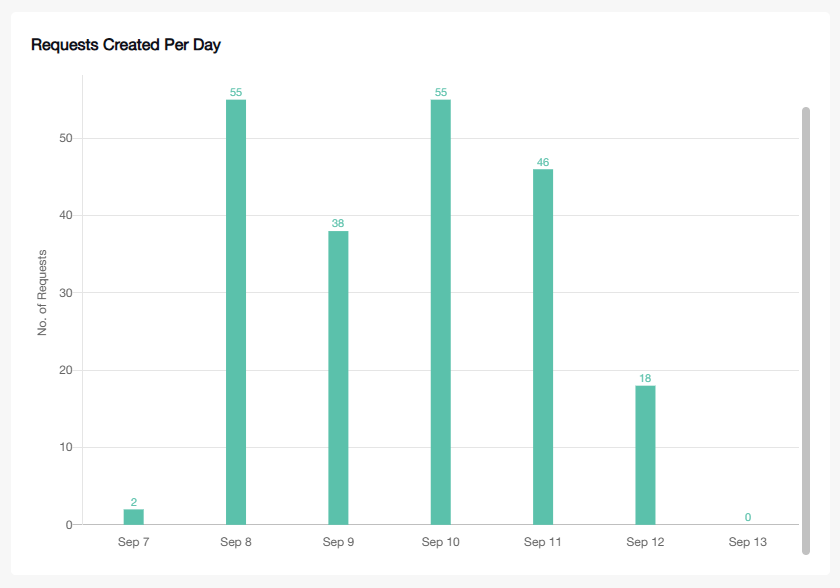
Requests Created Per Day
This section will show the request count raised per day when Weekly and Monthly Report is selected.
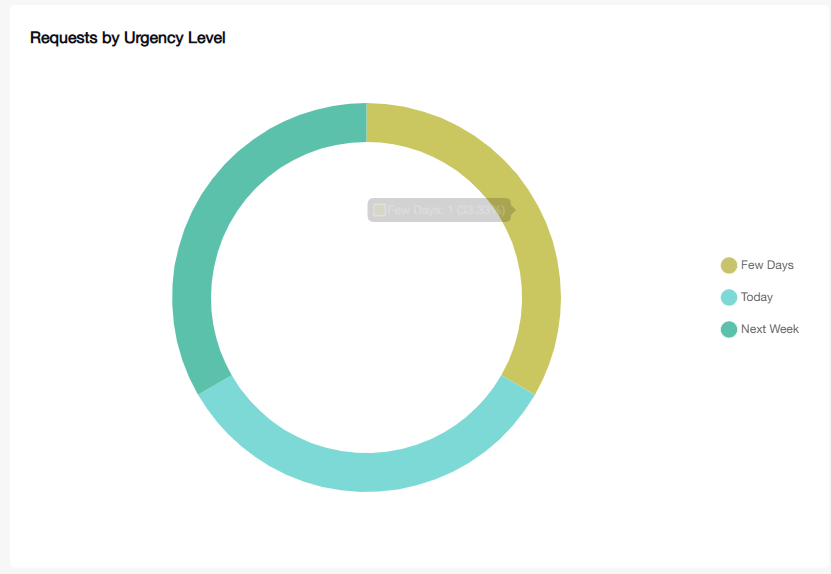
Requests by Urgency Level
This section will show the request with urgency level information. What urgency level has what amount of requests raised. Available in both Daily and Monthly reports.
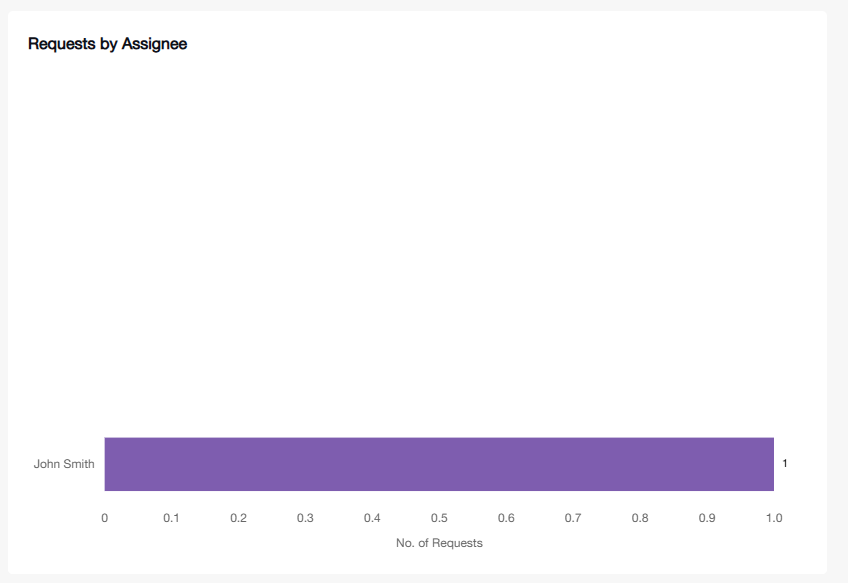
Requests by Assignee
This section will show which assignee has what count of requests assigned. Available in all Daily/Weekly/Monthly request reports but will show according to the created date of the request not the updated date.
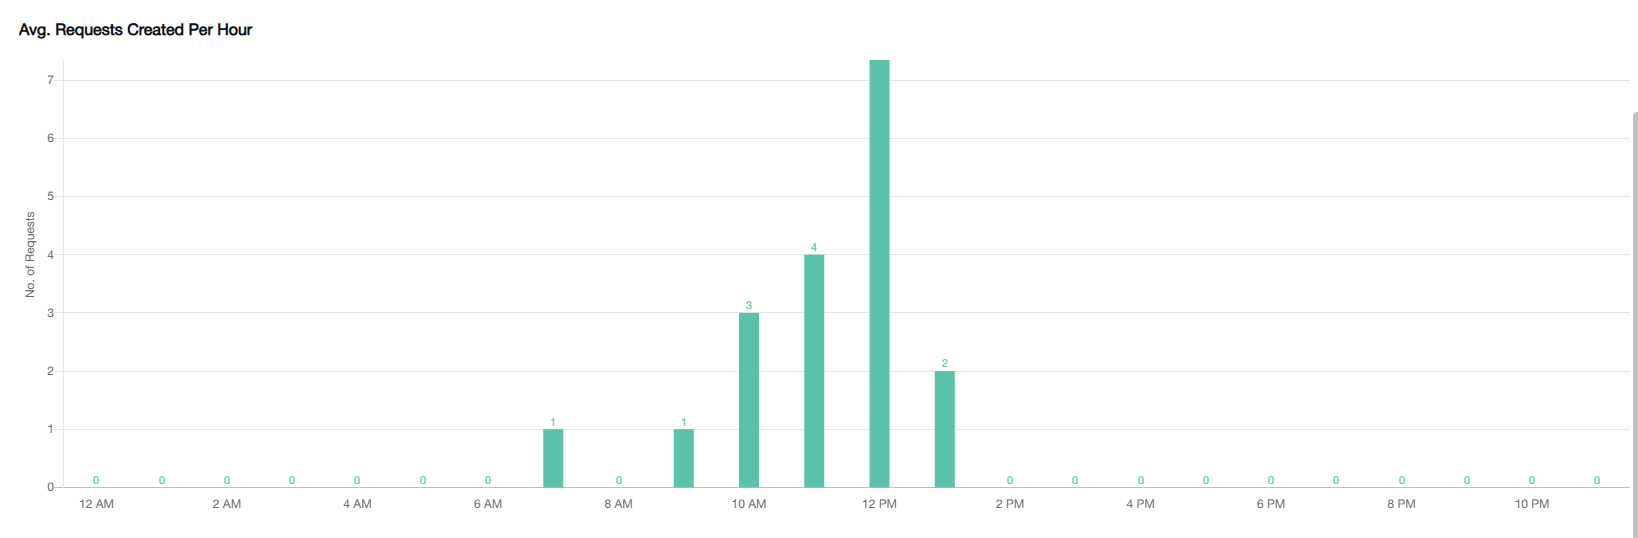
Avg. Requests Created Per Hour
This section will show request count created per hour in a day/week or month. Available for all Daily/Weekly/Monthly views.
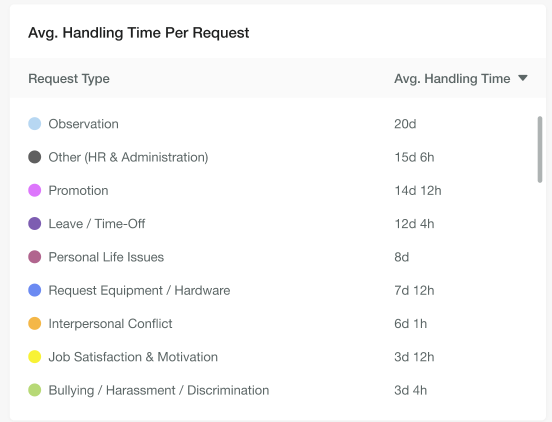
Avg. Handling Time Per Request
The average duration it takes to resolve a user request, starting from the moment it is assigned until it is successfully resolved. It will show with each request type. Available only for monthly reports and data is generated once the request is closed.
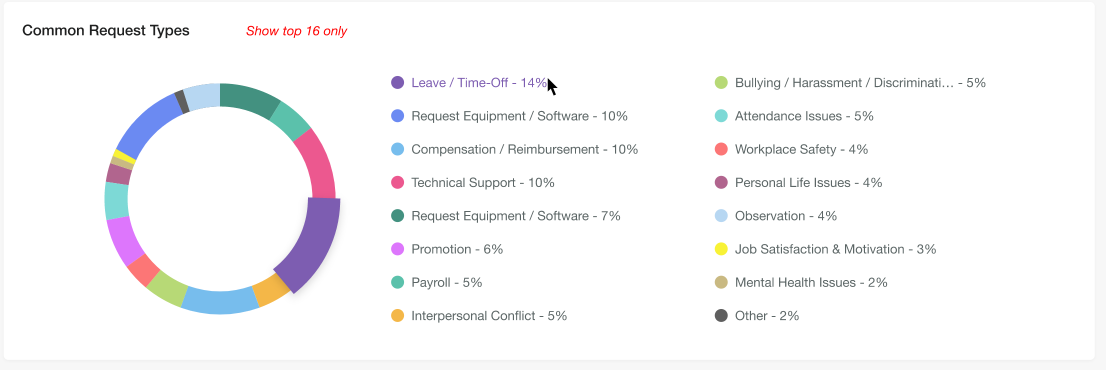
Common Request Types
This section shows which requests types are raised commonly in the organization. Available for daily/weekly/monthly reports.
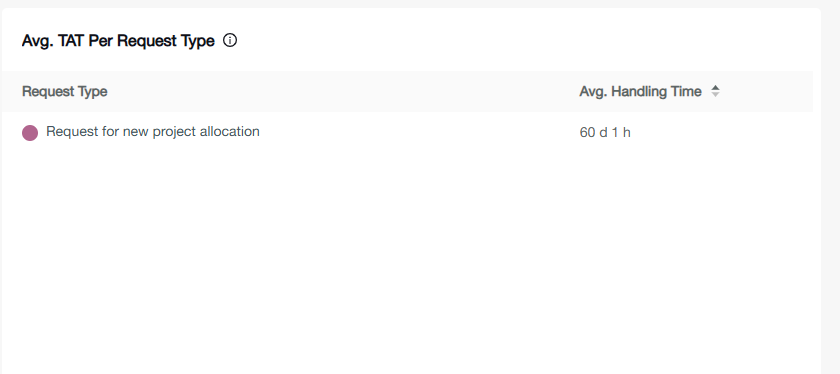
Avg. TAT Per Request Type
The average turnaround time for a new request to be assigned to a person or reassigned to another team. The data will be generated once the request has been closed.
Avg. Handling Time by Assignee
This section will visualize how much time taken by each assignee to resolve requests after getting assigned. Also each assignee will be shown with assigned request count.
Troubleshooting
-
If requests or teams are missing, confirm categories and members are properly configured.
-
Permission errors: Check role assignments and module settings.
-
Export problems: Ensure export permissions are granted and choose the correct format (CSV, XLS, XLSX).