Dashboard
The Dashboard page is where users can view a complete overview of hiring activity in Simplified Hire. It brings together job-related information, recruiter performance, candidate activity, upcoming interviews, calendar events, candidate sources, candidate stages, and inbox messages in one central page.
Common sections like the left menu and page header are available on the Dashboard page, allowing users to navigate across the platform while reviewing hiring progress.
To access the Dashboard page, log in to Simplified Hire and open the Dashboard from the left menu if it is not already displayed after login.
Dashboard Overview
The Dashboard gives users a quick summary of important recruitment information. Users can view the number of jobs posted, the number of active candidates, and the number of upcoming interviews.
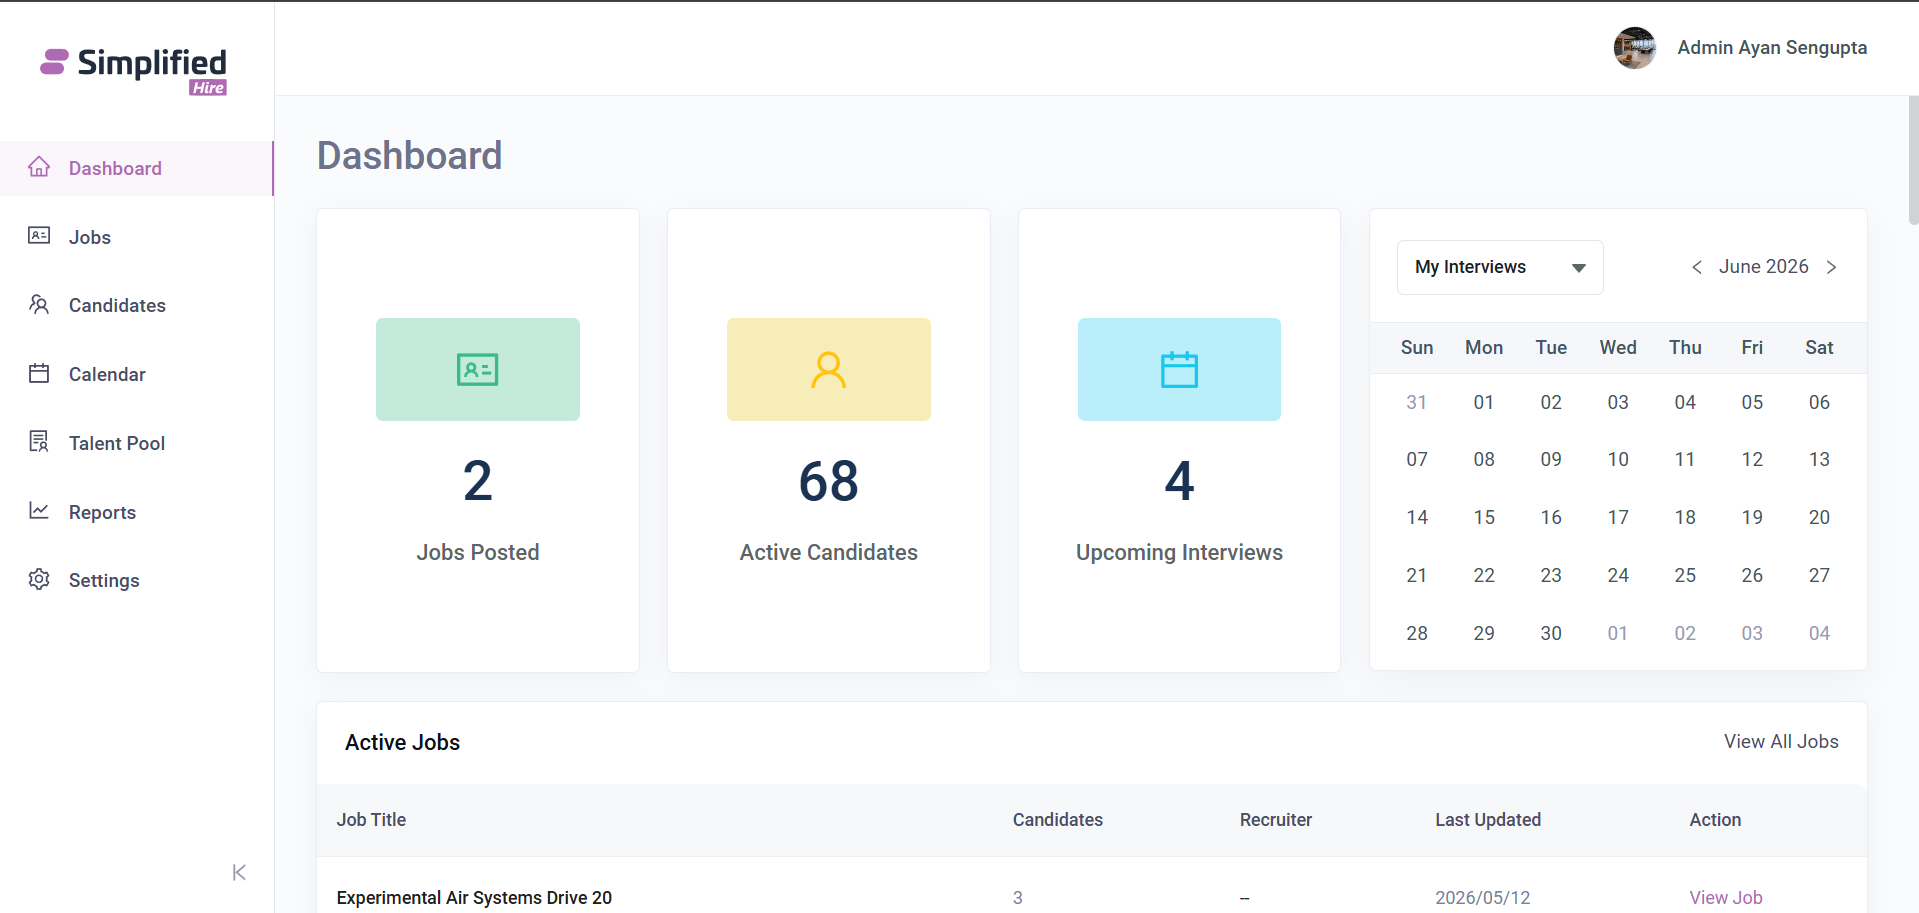
These summary cards help hiring teams understand the current hiring workload without opening each individual module separately.
The Dashboard also displays graphical and tabular hiring information so that users can quickly review the overall recruitment status of the organization.
Calendar and Scheduled Events
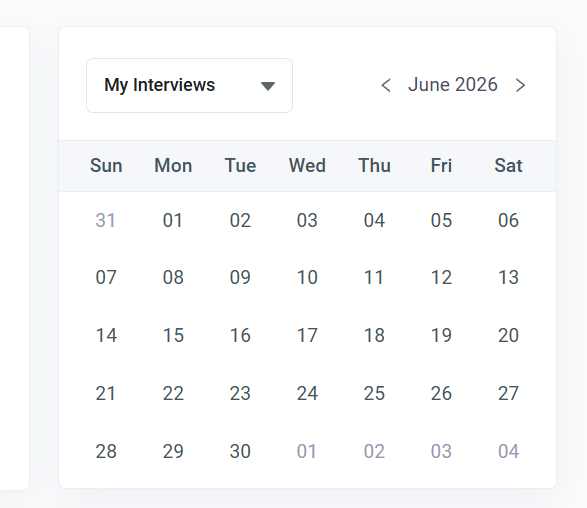
The Dashboard includes a calendar section where users can view scheduled events.
Users can view scheduled event information directly from the Dashboard calendar. If the user clicks on the calendar, the Calendar page will be displayed.
Active Jobs
The Active Jobs section displays active job information in a tabular format.
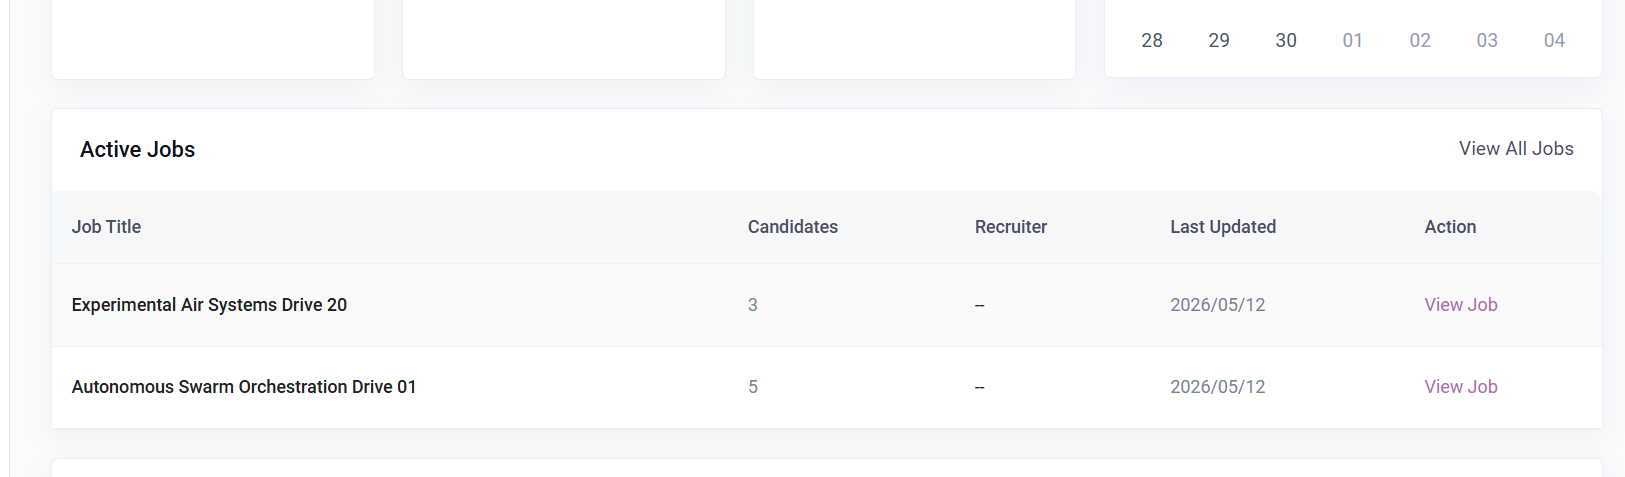
The table includes the following columns:
-
Job Title
-
Candidates
-
Recruiter
-
Last Updated
-
Action
The Candidates column shows the candidate count only. This helps users quickly understand how many candidates are connected with each active job.
Users can click the View All Jobs link from the Active Jobs section to open the jobs listing page.
Users can also click the View Jobs link under the Action column to view hiring progress details for a specific job.
Job Opening Status
The Job Opening Status section displays job opening information in graphical representation.
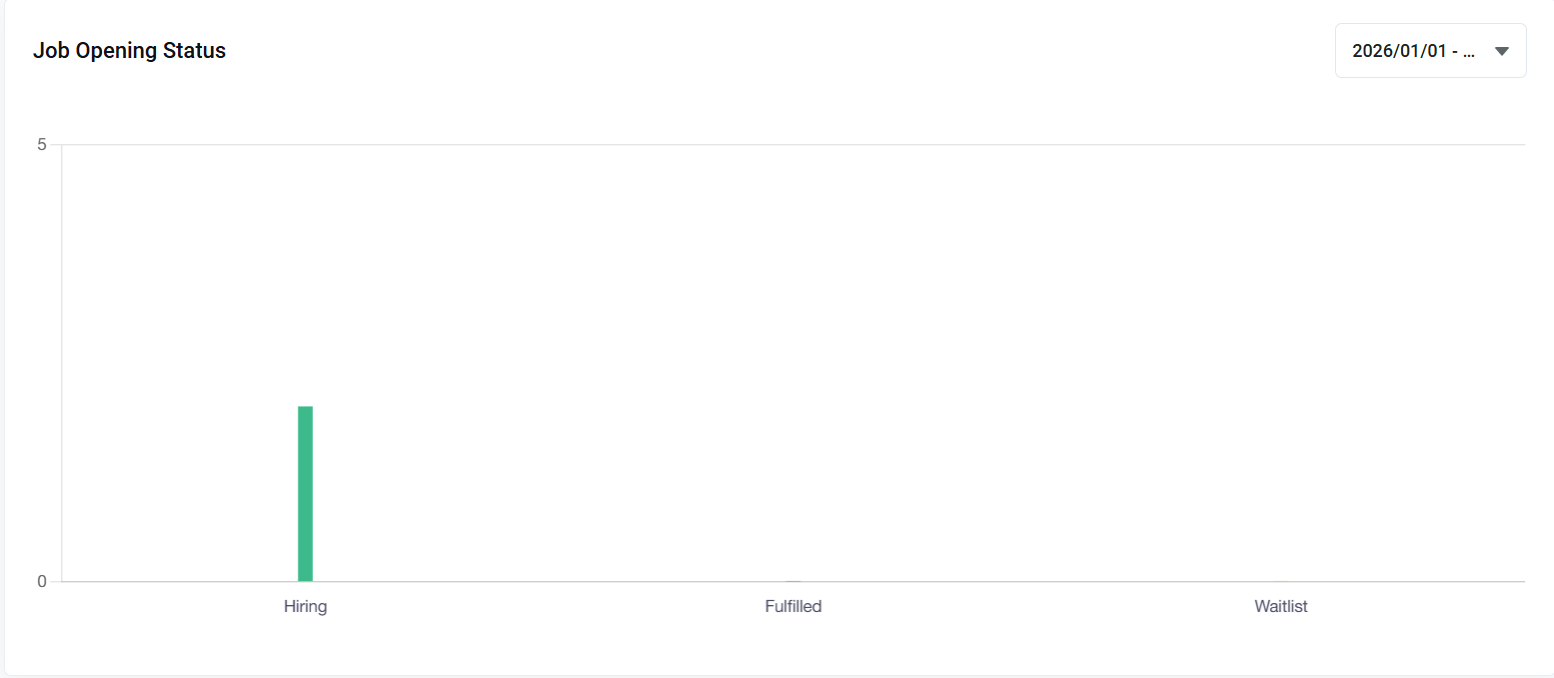
The graph is shown as a bar graph with two categories:
-
Hiring
-
FullFilled
-
Waitlist
This helps users understand how many job openings have already been filled and how many are still in progress.
Users can filter the Job Opening Status using the dropdown options available in this section.
The available filter options are:
-
This Week
-
Last 1 Month
-
Last 3 Months
-
Last 6 Months
-
Last 1 Year
-
Custom
After selecting a filter, the Job Opening Status graph should update based on the selected time duration.
Candidate Stages
The Candidate Stages section displays candidate movement across different hiring stages in graphical format.
The graph is shown as a bar graph with different candidate stages.
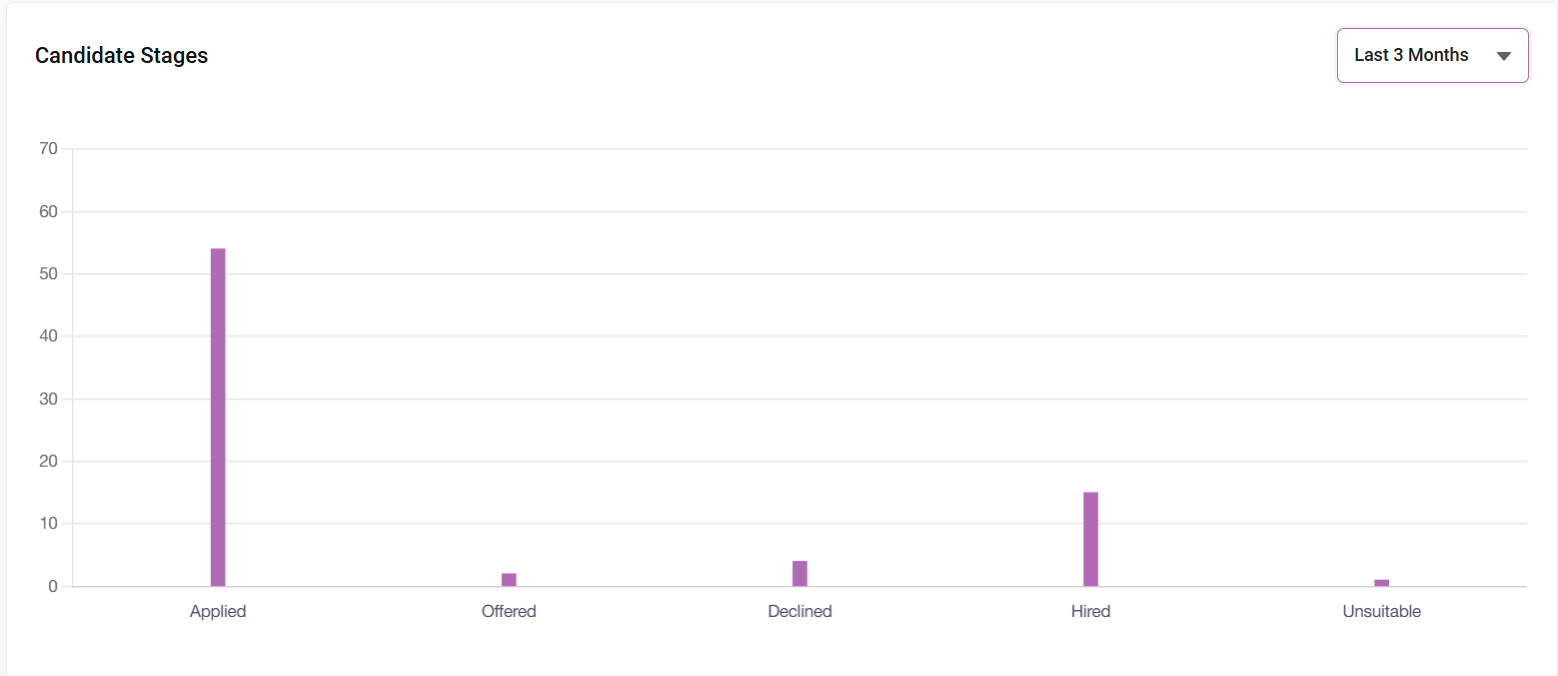
The available stages include:
-
Applied
-
Offered
-
Declined
-
Hired
-
Unsuitable
This graph helps users understand how candidates are distributed across the stages pipeline.
Users can filter Candidate Stages using the available dropdown options.
The available filter options are:
-
This Week
-
Last 1 Month
-
Last 3 Months
-
Last 6 Months
-
Last 1 Year
-
Custom
After selecting a filter, the Candidate Stages graph updates according to the selected time duration.
Recruiter Performance
The Recruiter Performance section displays recruiter-wise hiring information in tabular format.
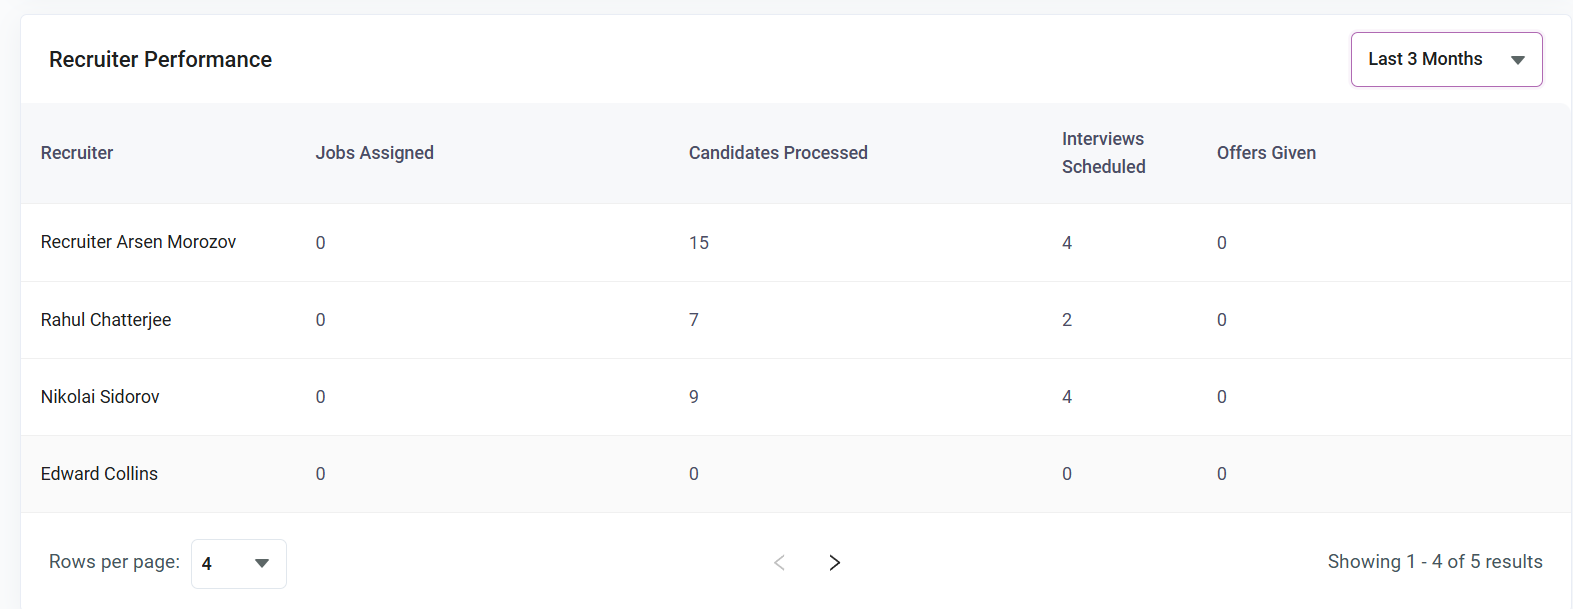
The table includes the following columns:
-
Recruiter
-
Jobs
-
Candidates
-
Interview Scheduled
-
Offers Given
The Jobs column displays the job count only, and the Candidates column displays the candidate count only.
This section helps users compare recruiter workload and candidate handling activity.
Users can filter Recruiter Performance using the available dropdown options.
The available filter options are:
-
This Week
-
Last 1 Month
-
Last 3 Months
-
Last 6 Months
-
Last 1 Year
-
Custom
After selecting a filter, the Recruiter Performance table should update based on the selected time duration.
Candidates By Sources
The Candidates By Sources section displays candidate source information in graphical format.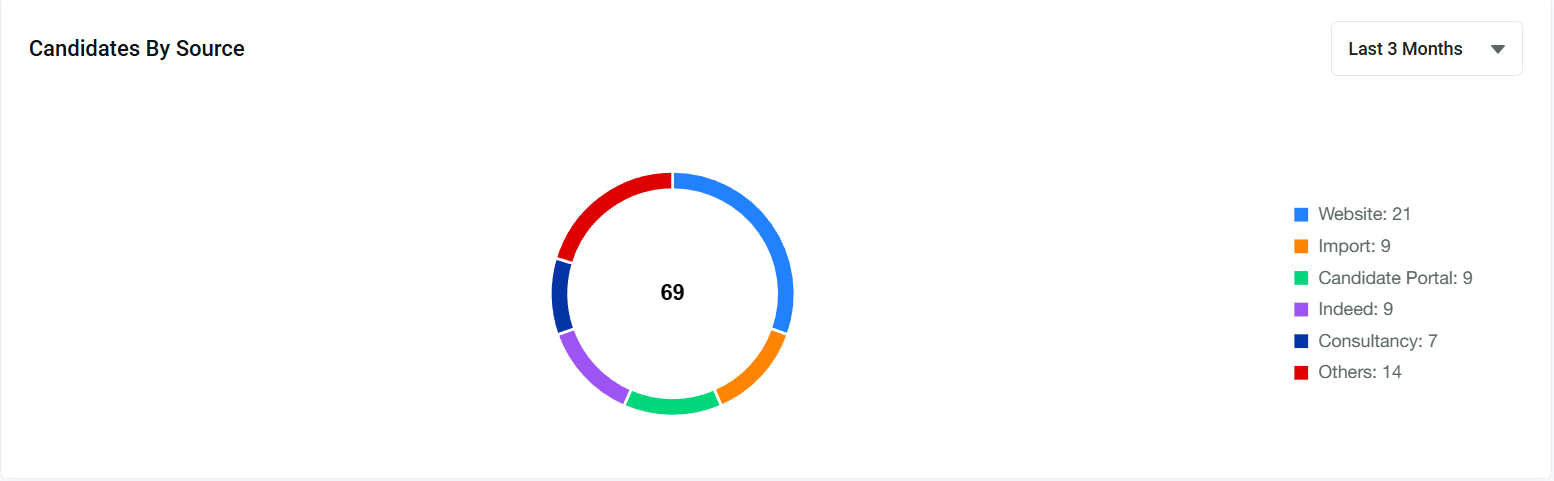
This information is shown as a pie chart.
The pie chart helps users understand from which sources candidates are coming into the hiring process.
Users can filter Candidates By Sources using the available dropdown options.
The available filter options are:
-
This Week
-
Last 1 Month
-
Last 3 Months
-
Last 6 Months
-
Last 1 Year
-
Custom
After selecting a filter, the Candidates By Sources chart should update according to the selected time duration.